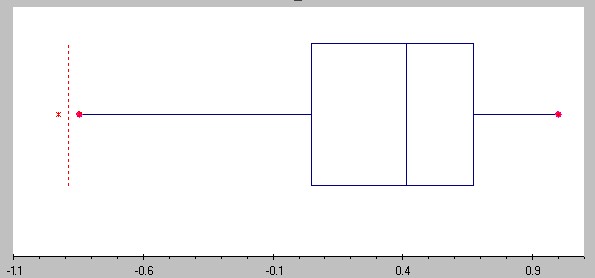
A box plot measures all of the different comparable numbers in scale in a simplistic yet complicated map. The mean and median are measured in the straight line representing the range with variances and other measurements within the box. This map measures the numbers of 40 smokers.
http://pirate.shu.edu/~wachsmut/Teaching/MATH1101/Descriptives/box.html
No comments:
Post a Comment